The introduction of color-coded price labels for economy rice dishes at Koufu establishments represents a significant step toward improving price transparency in Singapore’s food service industry. This review examines the initiative’s strengths, weaknesses, implementation challenges, and broader implications for consumers and businesses.
Background and Context

Economy rice, also known as cai png or mixed vegetable rice, is a quintessential affordable dining option in Singapore. However, it has long been plagued by pricing ambiguity, leading to frequent disputes between vendors and customers. The lack of clear price displays often results in “bill shock” when customers reach the cashier, creating frustration and distrust.
The Koufu-CASE partnership aims to address this systemic issue through a simple yet effective solution: standardized color-coded labels that communicate pricing at the point of selection.
The System Design
Color Coding Structure
- Blue: Seafood ($2.50/serving)
- Orange: Meat ($1.50/serving)
- Green: Vegetables ($1.00/serving)
- White: Premium items (variable pricing, handwritten)
Design Principles
The system employs universally recognizable colors with logical associations (green for vegetables mirrors their natural color), creating an intuitive visual language that transcends literacy barriers.
Strengths and Benefits
1. Enhanced Price Transparency
The most significant advantage is immediate price visibility. Customers can now calculate their meal cost before committing to selections, enabling better budget management and informed decision-making.

2. Reduced Disputes
By eliminating price ambiguity, the system addresses a major pain point in the economy rice experience. Both customers and vendors benefit from fewer confrontational interactions at checkout.
3. Consumer Empowerment
Transparent pricing shifts power dynamics toward consumers, allowing them to make value-based choices and compare options across different dishes within the same stall.
4. Simplified Operations
For vendors, standardized pricing within categories reduces decision fatigue and streamlines the ordering process. Staff can serve customers more efficiently when pricing is predetermined.
5. Accessibility
The color-coded approach is inclusive, benefiting those with limited literacy, language barriers, or visual processing preferences. Colors communicate faster than text in busy foodcourt environments.
6. Standardization Potential
As a replicable model, this system could become an industry standard, creating consistency across Singapore’s economy rice landscape.
Weaknesses and Limitations
1. Limited Price Differentiation
The four-tier system may be too simplistic for the diversity of economy rice offerings. Not all meats are equal in cost or quality—chicken costs less than pork ribs, yet both would receive orange labels at $1.50. This creates potential inequities.
2. Premium Item Ambiguity

White labels with handwritten prices partially defeat the purpose of standardization. Without predetermined pricing, “premium” becomes a catch-all category that could enable inconsistent pricing practices.
3. Rigidity in Pricing
Fixed category pricing removes vendor flexibility to adjust for ingredient cost fluctuations, seasonality, or portion sizes. A large serving of vegetables costs the same as a small one under this system.
4. Color-Blind Accessibility
Approximately 8% of males and 0.5% of females have some form of color vision deficiency. The system should incorporate additional identifiers (symbols, patterns, or text) to ensure universal accessibility.
5. Quality Obscuration
Standardized pricing within categories may obscure quality differences. Premium imported salmon and local fish would both receive blue labels at $2.50, potentially misleading quality-conscious consumers.

6. Implementation Costs
Printing labels, training staff, and maintaining the system requires investment that smaller operators may find burdensome, potentially limiting widespread adoption.
Implementation Challenges
Vendor Resistance
Economy rice vendors traditionally enjoy pricing autonomy. Some may resist standardization, viewing it as government overreach or a threat to profit margins, particularly those who charge premium prices for standard items.
Margin Compression
Vendors accustomed to charging higher prices may experience revenue reduction. A stall previously charging $2.00 for vegetables must now accept $1.00, potentially affecting viability.
Enforcement Difficulties
Without regulatory backing, the system relies on voluntary participation. Ensuring compliance and preventing price creep (items migrating to higher-priced categories) may prove challenging.
Consumer Education
Success depends on customers understanding the system. Tourists, elderly patrons, and infrequent visitors may require additional signage or explanation.
Label Maintenance

Physical labels require regular replacement due to wear and food splatter. Maintaining label visibility and accuracy adds to operational overhead.
Comparative Analysis
International Precedents
Many countries use visual pricing indicators:
- Japan’s convenience stores use clear price tags with color categorization
- Western cafeterias often employ digital displays with pricing
- Some European markets use traffic light nutrition labels
Singapore’s system adapts these concepts to local context, emphasizing affordability categories rather than nutritional content.
Alternative Approaches
Other solutions could include:
- Digital menu boards with pricing
- Weight-based pricing systems
- QR codes linking to detailed price lists
- Standardized menu cards with photos and prices
Economic and Social Implications
For Consumers
The system enhances consumer welfare by reducing information asymmetry. Budget-conscious diners, particularly elderly individuals and lower-income workers who rely on economy rice, gain greater financial predictability.
For Vendors
While initially disruptive, the system could build customer trust and loyalty. Transparent vendors may attract repeat customers, while the standardization simplifies inventory pricing and reduces negotiation time.
For the Industry
Widespread adoption could professionalize economy rice service, elevating it from informal to semi-formal dining. This may attract new operators while potentially displacing those reliant on opaque pricing.
Social Equity Considerations
Economy rice serves as an affordable food option for vulnerable populations. Price transparency ensures fair access and prevents exploitation, though standardized pricing must remain genuinely affordable.
Recommendations for Improvement
1. Expand Category Granularity
Consider five or six price tiers to better reflect actual ingredient costs and quality differences. For example:
- Dark blue: Premium seafood ($3.00)
- Light blue: Standard seafood ($2.00)
- Red: Premium meats ($2.00)
- Orange: Standard meats ($1.50)
- Yellow: Egg and tofu dishes ($1.00)
- Green: Vegetables ($0.80)
2. Standardize Premium Pricing
Replace handwritten white labels with predetermined premium tiers (e.g., $3.00, $3.50, $4.00) to maintain transparency even for special items.
3. Incorporate Universal Design
Add symbols or patterns to colors for color-blind accessibility. Consider tactile elements for vision-impaired patrons.
4. Implement Portion Guidelines

Establish minimum portion sizes for each category to prevent vendors from gaming the system with undersized servings.
5. Digital Integration
Develop companion mobile apps showing participating stalls, current pricing, and allowing customers to preview orders and costs.
6. Regular Price Review
Establish annual or bi-annual pricing reviews to adjust category prices based on ingredient cost inflation, ensuring vendor sustainability.
7. Incentivize Participation

Provide grants, subsidies, or marketing support to encourage adoption among smaller operators who may face implementation barriers.
8. Robust Monitoring
Create reporting mechanisms for consumers to flag non-compliance and establish regular audits to ensure system integrity.
Success Metrics and Evaluation
To assess effectiveness, stakeholders should track:
- Consumer satisfaction and complaint rates
- Pricing dispute frequency at participating vs. non-participating stalls
- Adoption rates across Singapore’s economy rice sector
- Price consistency within categories across stalls
- Revenue impacts on participating vendors
- Customer traffic changes at labeled stalls
Long-Term Viability

Sustainability Factors
The system’s long-term success depends on:
- Maintaining broad vendor participation
- Keeping prices genuinely affordable amid inflation
- Preventing category manipulation
- Achieving critical mass for industry-wide normalization
- Government support without heavy-handed regulation
Scalability Potential
If successful with economy rice, the model could extend to:
- Other cafeteria-style dining formats
- Buffet pricing structures
- Hawker center standardization initiatives
- Regional adoption across Southeast Asia
Conclusion
Koufu’s color-coded price labeling system represents a pragmatic, consumer-friendly innovation addressing a long-standing market failure in Singapore’s food service sector. While not without limitations, the initiative’s strengths—particularly enhanced transparency, reduced disputes, and improved consumer empowerment—outweigh its weaknesses.
The system’s ultimate success will depend on widespread adoption beyond Koufu, continuous refinement based on feedback, and maintaining affordability as its core principle. With proper implementation, monitoring, and evolution, color-coded labeling could transform economy rice from a source of pricing frustration into a model of transparent, fair, and accessible dining.
Final Assessment
Overall Rating: 7.5/10
Strengths: Addresses real consumer pain points, simple and intuitive, scalable model
Weaknesses: Limited pricing flexibility, potential vendor resistance, accessibility gaps
Recommendation: Proceed with phased expansion while implementing suggested improvements
This initiative deserves support as a meaningful step toward fairer food pricing, with the understanding that ongoing refinement will maximize its benefits for Singapore’s diverse dining community.
Food remains one of the most significant household expenses in Singapore, accounting for 20.3% of average household expenditure as of 2017-2018, making it the second largest expense category after housing. For everyday Singaporeans navigating the rising cost of living, understanding where and what to eat can make a substantial difference to monthly budgets. This comprehensive review analyzes food pricing patterns across Singapore’s hawker centres, food courts, and kopitiams based on the Institute of Policy Studies’ Makan Index 2.0 study and recent price developments.
The Daily Cost of Eating Out

The baseline cost of eating all three meals at hawker centres, food courts, and kopitiams averages $16.89 per person daily, translating to approximately $506.70 monthly. This figure represents a significant portion of household income, particularly for lower and middle-income families. Breaking down these costs by meal reveals interesting patterns in pricing strategy and consumer behavior.
Breakfast emerges as the most economical meal at an average of $4.81, likely due to the simplicity of breakfast offerings and traditional pricing expectations. Lunch costs slightly more at $6.01, reflecting the heartier portions and greater variety demanded during the midday meal. Dinner commands the highest average price at $6.20, a premium that food vendors justify through larger portions, more complex preparations, and the perception of dinner as the main meal of the day.
Regional Price Variations: A Neighborhood-by-Neighborhood Analysis
One of the most surprising findings from the Makan Index 2.0 study is that food prices vary significantly across different neighborhoods, challenging common assumptions about where budget-conscious diners should head. Contrary to popular belief, mature estates do not necessarily offer the cheapest food options.
The Most Affordable Neighborhoods
Toa Payoh stands out as Singapore’s most budget-friendly neighborhood for eating out, with a combined daily average of just $15.98 for three meals. This mature estate benefits from a high concentration of traditional hawker centres where long-established vendors maintain competitive pricing. The neighborhood attracts a predominantly local customer base with strong price sensitivity, forcing vendors to keep prices reasonable to maintain patronage.
Queenstown takes the crown for the cheapest breakfast at $4.33 on average, nearly 80 cents cheaper than Marine Parade. The area’s older hawker centres and kopitiams have resisted the upward price pressures affecting newer developments, partly due to lower rental costs and vendors who prioritize volume over premium pricing.
For lunch, Kallang offers the best value at $5.64, making it an attractive option for office workers willing to travel slightly further from the Central Business District. The neighborhood’s mix of industrial areas and residential estates creates competition among food vendors catering to both blue-collar workers and residents.
Central Region: Challenging Conventional Wisdom
The central region defies expectations by offering the cheapest prices for drinks across the board, including kopi-o, kopi, iced Milo, iced lime juice, and canned drinks. This counterintuitive finding suggests that high foot traffic and intense competition in central areas force beverage sellers to maintain aggressive pricing to attract customers. Additionally, central region stalls benefit from economies of scale, processing higher volumes that allow them to keep per-unit costs low.
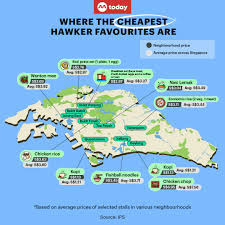
Bukit Timah emerged as having the cheapest chicken rice at $3.63, while Geylang and Queenstown tied for the cheapest kopi at $1.13, demonstrating that premium locations don’t always translate to premium prices for basic items.
Western Region: The Breakfast Champion
The western region, particularly Bukit Batok, offers Singapore’s cheapest roti prata set at $2.76, significantly below the island-wide average of $2.97. Bukit Panjang follows closely with the cheapest breakfast set of kaya toast, two soft-boiled eggs, and coffee or tea at $2.87. This western advantage for breakfast items may reflect the region’s demographic composition and the presence of established Indian Muslim food vendors who have maintained traditional pricing structures.
The Premium Neighborhoods
At the opposite end of the spectrum, Bishan commands the highest overall daily food cost at $18, a full $2 more than Toa Payoh. This $2 daily difference amounts to $730 annually—a significant sum that could cover several months of mobile phone bills or contribute to emergency savings.
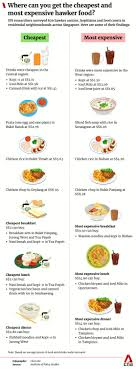
Marine Parade stands out as particularly expensive for breakfast at $5.12 and harbors some of the priciest individual items in the study. Economic rice sets in Marine Parade average $4.18 compared to the Singapore-wide average of $3.44, while fishball noodles cost $4.23 versus $3.71 elsewhere. This premium likely reflects the area’s proximity to tourist attractions, beachfront location, and demographic skewing toward middle and higher-income residents less sensitive to hawker food prices.
Sembawang, despite being a suburban northern estate, surprisingly has the most expensive lunch at $6.35. This counterintuitive pricing may result from limited food options in certain parts of the neighborhood, reducing competition and allowing vendors to charge more.
Establishment Type: The Price Hierarchy
The study confirms what most Singaporeans intuitively understand: where you eat matters as much as what you eat. A clear pricing hierarchy exists across the three main categories of food establishments.

Air-conditioned food courts consistently charge the highest prices, leveraging their climate-controlled comfort, modern facilities, and often superior ambiance. The convenience of air conditioning comes with a premium that can add 15-25% to meal costs compared to hawker centres.
Kopitiams occupy the middle ground, offering partially sheltered environments with ceiling fans but without air conditioning. Their semi-formal setup and mixture of traditional and modern stalls result in moderate pricing that balances affordability with some degree of comfort.
Hawker centres remain the champion of affordability, with their open-air or minimally enclosed structures keeping overhead costs low. Government subsidies for hawker centre construction and maintenance help vendors maintain competitive pricing, fulfilling the original mission of providing affordable meals to all Singaporeans.
Lunch Prices Across Singapore: A Working Professional’s Guide
For office workers and professionals deciding where to eat lunch, understanding regional price variations can inform smarter dining choices. The lunch price data reveals clusters of affordability that don’t always align with intuitive expectations about central versus suburban areas.
The Central Region shows remarkable internal variation. Bukit Timah offers the cheapest lunch at $5.28, likely due to competition from university students and budget-conscious residents. Kallang follows at $5.64, benefiting from its mix of industrial and residential areas. Toa Payoh ($5.67), Geylang ($5.87), and Bukit Merah ($5.97) cluster in the affordable range, all staying below the $6 threshold.
Interestingly, Novena ($5.99), Queenstown ($6.07), and Marine Parade ($6.09) cost more despite being established areas, possibly reflecting their proximity to hospitals, shopping areas, or tourist attractions. Bishan rounds out the central region as the most expensive at $6.15.
The North-East Region presents a compact price range from Hougang’s $5.77 to Punggol’s $6.22. Hougang’s affordability makes it attractive for those working in the northeast corridor, while the newer towns of Sengkang ($6.17) and Punggol ($6.22) command slight premiums, perhaps reflecting their modern facilities and younger demographic willing to pay more for dining convenience.
In the West, prices range from Bukit Batok’s reasonable $5.89 to Jurong East’s relatively steep $6.34. The progression generally follows the age of estates, with older neighborhoods like Bukit Batok and Clementi ($5.99) offering better value than newer commercial hubs like Jurong East.
The East shows moderate pricing with Bedok at $6.05, Pasir Ris at $6.14, and Tampines at $6.31. The gradual increase correlates with distance from central areas and the prevalence of newer, more modern food courts in Tampines.
The North exhibits the highest lunch prices overall, with Yishun at $6.07, Woodlands at $6.35, and Sembawang topping the charts at $6.38. This northern premium seems anomalous given these are not premium neighborhoods, but may reflect the limited competition and captive customer base in areas with fewer food establishment clusters.
Individual Dish Analysis: Finding the Best Deals
Beyond neighborhood averages, savvy diners can optimize their food spending by knowing which specific dishes offer the best value in different locations.
Roti prata sets exemplify the value available in western Singapore, with Bukit Batok offering sets at $2.76 compared to Bishan’s $3.19. This 43-cent difference per meal adds up quickly for regular consumers of this breakfast staple. The western region’s strong Indian Muslim food heritage and competition among prata specialists keep prices competitive.
Chicken rice, Singapore’s unofficial national dish, finds its most affordable expression in Bukit Timah at $3.63. Given chicken rice’s ubiquity and the standardization of portion sizes, this 17-cent savings versus the $3.80 average represents good value for a complete, protein-rich meal.
Economic rice demonstrates massive price variation, ranging from Serangoon’s $3.11 for a two-vegetable, one-meat combination to Marine Parade’s $4.18 for the same selection. This $1.07 difference represents a 34% premium, the largest percentage variation among commonly consumed items. Economic rice pricing likely reflects the discretion vendors have in portioning and selecting ingredients, making it more susceptible to neighborhood demographics and vendor judgment.
Beverages show relative price stability, though even here variations exist. Kopi costs $1.13 in Geylang and Queenstown but reaches $1.30 in Choa Chu Kang and Serangoon, a 17-cent or 15% premium. While seemingly small, coffee drinkers consuming two cups daily would spend an extra $124 annually at the higher price point.
Chicken chop, representing Western-style hawker fare, costs $6.95 at its cheapest but reaches $8.28 in Bukit Panjang, a substantial $1.33 difference. This variation suggests that Western-style dishes, being less standardized and traditional, face less price pressure from consumer expectations.
The GST Impact and Price Stability
When Singapore increased its Goods and Services Tax in 2023, concerns mounted about its impact on hawker food prices. The Makan Index 2.0 researchers revisited 50 establishments comprising 263 individual stalls to assess this impact. Their findings offer reassurance: average price increases at these revisited stalls did not exceed 30 cents, with most food items seeing increases of 10 cents or less.
This restrained response reflects several factors. Many hawkers absorbed part of the GST increase rather than passing the full cost to customers, demonstrating community-minded pricing. The competitive nature of hawker centres, where similar stalls sit side by side, creates natural price resistance. Additionally, established customer relationships and reputational concerns incentivized vendors to minimize price increases.
However, broader economic forces have proven more impactful than GST adjustments. Hawker food prices increased by 6.1% in 2023, marking the highest annual increase since 2008. This surge resulted from post-COVID supply chain disruptions, the Russia-Ukraine conflict’s impact on food imports, and rising operational costs including rent, utilities, and wages. By May 2024, hawker food inflation had moderated to 3.7%, suggesting price stabilization as supply chains normalized and cost pressures eased.
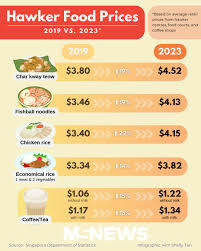
Current 2024 pricing reflects these increases, with popular dishes now costing noticeably more than during the 2022 survey period. Char kway teow now averages $4.52 compared to $4.18 previously, while fishball noodles have risen from $3.77 to $4.13. These increases of 8-10% over roughly 18 months align with broader food inflation trends while remaining more moderate than restaurant or café pricing increases.
Strategies for Budget-Conscious Diners
Armed with this pricing intelligence, Singaporeans can employ several strategies to minimize food expenses without sacrificing meal quality or variety.
First, strategic neighborhood selection pays dividends. Those with flexible work arrangements or remote work options might choose to eat in neighborhoods like Toa Payoh, Kallang, or Bukit Timah rather than expensive areas like Marine Parade or Bishan. Even occasional neighborhood switching for meals can generate savings.
Second, prioritizing hawker centres over food courts and kopitiams provides the most direct path to savings. The climate-controlled comfort of food courts comes with a 15-25% premium that quickly accumulates. Singaporeans eating out twice daily could save $150-200 monthly by consistently choosing hawker centres.
Third, taking advantage of digital payment incentives amplifies savings. The DBS PayLah! Hawker Meal campaign offers up to $3 cash rebates at participating hawker stalls every Friday for the first 100,000 users weekly. While requiring Friday lunchtime flexibility, regular users can save $12 monthly or $144 annually. ShopBack provides ongoing cashback for digital payments at hawkers, kopitiams, and food courts, typically offering 1-3% cash back that accumulates over time.
Fourth, meal timing optimization leverages breakfast’s lower cost structure. Starting the day with a $2.87 breakfast set from Bukit Panjang instead of a $5 café breakfast saves $2.13 daily or $778 annually. For those who must eat out regularly, making breakfast the home-cooked meal while optimizing lunch and dinner locations provides balance between convenience and economy.
Fifth, dish selection matters. Opting for economic rice over premium dishes, choosing chicken rice over chicken chop, and selecting local beverages over imported soft drinks all contribute to lower meal costs without nutritional sacrifice.
Limitations and Considerations
The Makan Index 2.0 study, while comprehensive, has limitations that diners should understand. Prices were recorded at face value without adjusting for portion sizes or quality variations. A $3.50 chicken rice serving with generous portions and quality ingredients offers better value than a $3.30 serving with minimal meat and average rice. Similarly, the study doesn’t account for ingredient quality variations—one vendor’s economic rice might feature fresh vegetables and tender meat while another’s includes wilted greens and tough protein.

The study’s September to November 2022 collection period, with January-February 2023 GST follow-ups, means current prices have likely increased further. The 6.1% inflation in 2023 and subsequent price adjustments mean 2024-2025 prices exceed those reported, though relative price relationships between neighborhoods likely remain similar.
Geographic coverage, while extensive at 829 establishments across 26 neighborhoods, couldn’t capture every hawker centre, food court, and kopitiam in Singapore. Smaller neighborhoods and newly opened establishments aren’t represented, potentially missing pockets of exceptional value or concerning price inflation.
The study’s focus on 18 commonly consumed items provides useful benchmarks but doesn’t capture the full diversity of Singapore’s food landscape. Specialized dishes, ethnic cuisine variations, and premium hawker offerings fall outside the scope, limiting insights for diners with specific dietary preferences or adventurous palates.
The Broader Context: Food Prices and Living Standards
Food pricing in Singapore reflects broader socioeconomic realities. The government’s recognition of food costs through measures like increased GST vouchers, Assurance Package cash payouts, and enhanced CDC vouchers acknowledges that food expenses significantly impact household budgets, particularly for lower-income families.
The fact that food represents 20.3% of household expenditure, with more than half spent at hawker centres, coffee shops, and similar establishments, underscores how integral affordable eating out remains to Singaporean life. Unlike societies where eating out represents luxury or convenience, Singapore’s hawker culture makes it an economic necessity for many, particularly dual-income households lacking time for extensive home cooking.
The government’s subsidization of hawker centre infrastructure and the continued focus on keeping hawker food affordable represents implicit recognition that food security extends beyond availability to encompass affordability. When basic local dishes become unaffordable, social stability concerns emerge alongside economic ones.
Recent price increases, while moderated from 2023’s peaks, still challenge household budgets. The 8-10% increases in common dishes since the study period represent approximately $1 daily or $30 monthly for someone eating out twice daily. For lower-income households already stretched thin, this represents a meaningful reduction in discretionary spending or savings capacity.
Looking Forward: Trends and Implications
Several trends will likely shape Singapore’s food pricing landscape in coming years. First, generational succession in hawker centres may influence pricing as younger hawkers take over stalls. Younger vendors might be less willing to maintain the “affordable food” ethos that characterized the pioneer generation, instead seeking market-rate returns on their labor and capital.
Second, continued rental cost pressures, particularly as older hawker centres undergo renewal and upgrading, could drive prices upward. While the government maintains relatively affordable hawker stall rental rates, market forces and rising land values create constant pressure for increases.
Third, labor costs will likely continue rising as Singapore’s tight labor market and aging population make hawker work less attractive to younger workers. Automation and efficiency improvements may partially offset this, but labor-intensive food preparation has inherent limits to productivity gains.
Fourth, climate change and global supply chain volatility will continue impacting ingredient costs. Singapore’s heavy reliance on food imports makes it vulnerable to international price shocks, weather disruptions, and geopolitical tensions affecting food trade.
Fifth, changing consumer preferences toward healthier, more sustainable, and premium ingredients could bifurcate the hawker market. Some stalls may maintain traditional affordable pricing while others pursue premium positioning with organic ingredients, sustainable sourcing, and elevated preparations at higher prices.
Conclusion
Understanding food prices in Singapore requires appreciating both the granular details of neighborhood-by-neighborhood variations and the broader context of food’s role in Singaporean life. The Makan Index 2.0 study provides invaluable data for budget-conscious diners, revealing that strategic choices about where and what to eat can save hundreds of dollars annually.
For the average Singaporean spending $506.70 monthly eating hawker meals, the difference between optimized and non-optimized dining could reach $50-80 monthly or $600-960 annually—a sum sufficient to fund a modest vacation, boost emergency savings, or reduce financial stress. By choosing neighborhoods like Toa Payoh over Bishan, hawker centres over food courts, and being mindful of individual dish pricing, families can maintain Singapore’s beloved eating-out culture while protecting their financial wellbeing.
Yet beyond individual optimization strategies, the broader question remains: how can Singapore maintain its hawker food affordability as a cornerstone of social life while ensuring hawkers earn sustainable livelihoods? This tension between affordability and sustainability will define the next chapter of Singapore’s food story, requiring continued government support, creative solutions, and shared commitment to preserving an essential element of Singaporean identity.
The data shows that affordable food remains available across Singapore, but increasingly requires knowledge, flexibility, and strategic thinking to access consistently. As prices continue evolving, staying informed about where the best value exists becomes not just a matter of frugality but an essential life skill for navigating Singapore’s high cost of living.
Singapore continues to be one of the world’s most expensive cities, yet its food scene offers remarkable diversity across all price points. Hawker food prices in Singapore went up 6.1 percent in 2023, the highest increase since 2008. These increases were primarily driven by more costly imported food ingredients due to supply chain disruptions. Fast food establishments saw a 7.7 percent increase in the price of food items, while in restaurants, food prices went up by 5.9 percent.
Currency Impact
The Singapore dollar’s strength affects food costs significantly. With most ingredients being imported due to limited domestic agriculture, currency fluctuations directly impact food prices. As of 2025, the SGD remains relatively stable, though inflation continues to influence dining costs.
Daily Food Budget Breakdown
Tourist Daily Spending
- Budget traveler: $15-20 SGD per day
- Mid-range traveler: $25-40 SGD per day
- Luxury traveler: $80-150 SGD per day
Local Daily Spending
A study conducted by the Institute of Policy Studies (IPS) found that the average cost of eating out for three meals is S$16.89 if one visits hawker centers, food courts, and kopitiams.
Detailed Food Categories and Examples
1. Hawker Centers and Food Courts (Budget-Friendly)
Average meal cost: $3-$6
Popular Hawker Dishes with Current Prices:
- Hainanese Chicken Rice: $5-8 SGD
- Char Kway Teow: $4-6 SGD
- Laksa: $5-7 SGD
- Mee Goreng: $4-5 SGD
- Satay: $0.80-1.20 SGD per stick (minimum 10 sticks)
- Carrot Cake (Chai Tow Kway): $3-5 SGD
- Wanton Mee: $4-6 SGD
- Fish Head Curry: $30 SGD (for sharing)
- Chili Crab: $7.90 SGD per 100g
- Rojak: $4-6 SGD
Beverages at Hawker Centers:
- Kopi/Teh: $1.20-2.00 SGD
- Fresh Juice: $2-4 SGD
- Soft drinks: $1.50-2.50 SGD
- Sugar Cane Juice: $1.50-2.50 SGD
2. Kopitiams (Traditional Coffee Shops)
Average meal cost: $4-8 SGD
Typical Kopitiam Menu:
- Kaya Toast Set: $4-6 SGD
- Soft-boiled Eggs: $1.50-2.00 SGD
- Milo Dinosaur: $2.50-3.50 SGD
- Nasi Lemak: $3-5 SGD
- Mee Siam: $4-6 SGD
3. Food Courts in Shopping Malls
Average meal cost: $6-10 SGD
Examples:
- Japanese Rice Bowl: $8-12 SGD
- Korean Bibimbap: $9-13 SGD
- Western Chicken Chop: $8-12 SGD
- Thai Pad Thai: $7-10 SGD
4. Vegetarian and Vegan Options
Vegetarian Hawker Food:
- Vegetarian Laksa: $7.50 SGD
- Chinese Rojak: $6.50 SGD
- Bee Hoon: $4-5 SGD
- Stir-fried Kai Lan: $10-24 SGD
- Fried Spring Roll: $2 SGD per piece
- Vegetarian Chicken Rice: $4-6 SGD
Vegan Restaurants:
- Vegan Burger: $12-18 SGD
- Plant-based Pasta: $15-22 SGD
- Vegan Ramen: $14-20 SGD
5. International Cuisine
Italian:
- Pizza: $25.90 SGD average
- Handmade Pasta: $15-25 SGD
- Risotto: $18-28 SGD
- Antipasti: $12-20 SGD
Mexican:
- Tacos: $19 SGD (Big Phish Taco)
- Burritos: $8-20 SGD
- Quesadillas: $14-18 SGD
- Nachos: $12-16 SGD
Japanese:
- Sushi: Starting from $35 SGD
- Ramen: $12-18 SGD
- Tempura Set: $15-25 SGD
- High-end Omakase: $280-680 SGD
Korean:
- Korean BBQ: $25-35 SGD per person
- Kimchi Jjigae: $12-16 SGD
- Bulgogi: $18-25 SGD
Indian:
- Biryani: $8-15 SGD
- Curry Sets: $10-18 SGD
- Dosa: $6-10 SGD
- Modern Indian (Thevar): $290+ SGD
6. Fast Food Chains
McDonald’s:
- Big Mac Meal: $8-10 SG
- Hokkaido Salmon Burger: $5.95-7.95 SGD
- Chicken McNuggets: $6-8 SGD
- Curry Sauce: $0.50 SGD
- Chocolate Pie: $1-1.50 SGD
KFC:
- Original Recipe Chicken: $4-5 SGD
- Zinger Burger: $7-8 SGD
- Fried Chicken Meal: $11-13 SGD
Burger King:
- Whopper: $9-15 SGD
- Beef Burger: $9+ SGD
- Nuggets: $6+ SGD
7. Casual Dining Restaurants
Average meal cost: $20-40 SGD per person
Examples:
- Pasta dishes: $16-25 SGD
- Grilled fish: $22-35 SGD
- Steaks: $28-45 SGD
- Salads: $12-18 SGD
- Desserts: $8-12 SGD
8. Fine Dining
Average meal cost: $75-150 SGD per person
Examples:
- 3-course lunch: $35-60 SGD
- 5-course dinner: $80-120 SGD
- Wine pairing: $45-80 SGD additional
- Michelin-starred tasting menu: $280-680 SGD
Grocery Shopping Costs
Monthly Grocery Budget:
- Single person: $400-600 SGD
- Family of 4: $800-1,200 SGD
Common Grocery Items:
- Rice (5 kg): $8-15 SGD
- Chicken breast (1 kg): $8-12 SGD
- Pork (1 kg): $12-18 SGD
- Fish (1 kg): $15-25 SGD
- Milk (1L): $3.72 SGD
- Eggs (dozen): $3-4 SGD
- Bread (loaf): $2-4 SGD
- Vegetables: $0.55-2.25 SGD per kg
- Fruits: $2-8 SGD per kg
Supermarket Chains:
- NTUC FairPrice: Most affordable
- Cold Storage: Mid-range
- Jason’s Market Place: Premium
Regional Price Variations
Central Business District (CBD):
- Hawker meals: $6-10 SGD
- Food court meals: $8-15 SGD
- Restaurant meals: $25-50 SGD
Residential Areas:
- Hawker meals: $3-6 SGD
- Food court meals: $5-10 SGD
- Restaurant meals: $15-30 SGD
Tourist Areas (Orchard Road, Marina Bay):
- Hawker meals: $7-12 SGD
- Food court meals: $10-18 SGD
- Restaurant meals: $30-80 SGD
Money-Saving Tips
Budget-Friendly Options:
- Hawker centers: A full meal can cost as little as $3
- Kopitiams: Traditional coffee shops with affordable local fare
- Supermarket prepared foods: $3-8 SGD per meal
- Happy hour promotions: 3-7 PM at many restaurants
- Lunch sets: Often 30-50% cheaper than dinner
Best Value Hawker Centers:
- Chinatown Complex: Cheapest options
- Tiong Bahru Market: Good value, local crowd
- Maxwell Food Centre: Tourist-friendly with reasonable prices
- Newton Food Centre: Higher prices but convenient location
Price Trends and Predictions
Recent Changes:
- Prices of beverages at hawker centers increased between 4.6 and 8.6 percent.
- Restaurant prices increased by 5.9% in 2023
- Fast food prices rose by 7.7% in 2023
2025 Outlook:
- Prices expected to stabilize after 2023’s significant increases
- Continued pressure from import costs
- Government initiatives to keep hawker food affordable
Conclusion
Singapore’s food scene in 2025 offers something for every budget, from $3 hawker meals to $500+ fine dining experiences. While prices have increased significantly due to inflation and supply chain disruptions, the diversity of options ensures that quality food remains accessible across all price points. The key is knowing where to look and what to expect at each price tier.
Daily Budget Recommendations:
- Ultra-budget: $12-15 SGD (hawker centers only)
- Budget: $20-25 SGD (mix of hawker and casual dining)
- Moderate: $35-50 SGD (casual dining with some restaurant meals)
- Comfortable: $60-80 SGD (regular restaurant dining)
- Luxury: $100+ SGD (fine dining experiences)
The hawker center culture remains Singapore’s greatest culinary asset, offering world-class food at incredibly affordable prices, making it possible to eat well without breaking the bank even in one of the world’s most expensive cities.
- Limited Information: Most establishments appear to be dine-in focused
- Takeaway Available: Several hawker stalls and coffee shops
- No Delivery Mentioned: For most locations
Tourist Accessibility:
- Highest Value: Maxwell Food Centre, Tong Ah Eating House, Original Katong Laksa, Atlas Bar
- Moderate Accessibility: Most hawker centres and established restaurants
- Advance Planning Required: The Ampang Kitchen, Burnt Ends reservations
Cultural Significance:
- Historical: Tong Ah (1939), Singapore Zam Zam (1908), Song Fa (1969)
- Heritage Preservation : Kim Choo Kueh Chang, Tan’s Tu Tu Coconut Cake
- Modern Innovation: Burnt Ends, Cloudstreet, % Arabica
Cooking Techniques Highlighted:
Maxthon
In an age where the digital world is in constant flux and our interactions online are ever-evolving, the importance of prioritizing individuals as they navigate the expansive internet cannot be overstated. The myriad of elements that shape our online experiences calls for a thoughtful approach to selecting web browsers—one that places a premium on security and user privacy. Amidst the multitude of browsers vying for users’ loyalty, Maxthon emerges as a standout choice, providing a trustworthy solution to these pressing concerns, all without any cost to the user.

Maxthon, with its advanced features, boasts a comprehensive suite of built-in tools designed to enhance your online privacy. Among these tools are a highly effective ad blocker and a range of anti-tracking mechanisms, each meticulously crafted to fortify your digital sanctuary. This browser has carved out a niche for itself, particularly with its seamless compatibility with Windows 11, further solidifying its reputation in an increasingly competitive market.
In a crowded landscape of web browsers, Maxthon has forged a distinct identity through its unwavering dedication to offering a secure and private browsing experience. Fully aware of the myriad threats lurking in the vast expanse of cyberspace, Maxthon works tirelessly to safeguard your personal information. Utilizing state-of-the-art encryption technology, it ensures that your sensitive data remains protected and confidential throughout your online adventures.
What truly sets Maxthon apart is its commitment to enhancing user privacy during every moment spent online. Each feature of this browser has been meticulously designed with the user’s privacy in mind. Its powerful ad-blocking capabilities work diligently to eliminate unwanted advertisements, while its comprehensive anti-tracking measures effectively reduce the presence of invasive scripts that could disrupt your browsing enjoyment. As a result, users can traverse the web with newfound confidence and safety.
Moreover, Maxthon’s incognito mode provides an extra layer of security, granting users enhanced anonymity while engaging in their online pursuits. This specialized mode not only conceals your browsing habits but also ensures that your digital footprint remains minimal, allowing for an unobtrusive and liberating internet experience. With Maxthon as your ally in the digital realm, you can explore the vastness of the internet with peace of mind, knowing that your privacy is being prioritized every step of the way.