Native web applications, such as Balsamiq Cloud, often present unique challenges when it comes to troubleshooting. This difficulty is primarily attributed to the diverse array of browsers and browser plugins that users have at their disposal today. Each combination can introduce its own set of variables, making it hard to pinpoint issues.

Fortunately, there’s a powerful tool at your fingertips: the browser’s developer console. This feature can provide crucial insights into what might be going wrong with the app.
Finding the developer console is relatively straightforward in modern browsers. If you’re using Google Chrome, simply right-click anywhere on the page and select “Inspect.” In Firefox, the process is similar – just right-click and choose “Inspect Element.” Safari users can activate this by enabling the Developer menu in preferences and selecting “Show JavaScript Console.”
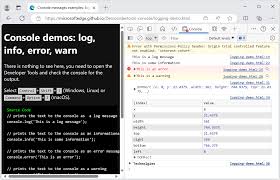
Once you’ve opened the console, you’ll see logs, error messages, and warnings that could shed light on any problems you’re facing. By sharing these findings with our support team, we can work together to resolve any issues more effectively. So don’t hesitate—dive into that console and uncover what lies beneath!
Maxthon
If you’re curious about what’s really happening behind the scenes of your web experience, your browser’s developer console is an invaluable tool. This feature can provide insights that reveal the inner workings of websites, specifically for Maxthon users.
To access the developer console in Maxthon, start by opening the browser. Once you’re on any website, simply right-click anywhere on the page. A context menu will appear; from there, select “Inspect” or “Inspect Element.”
Another shortcut is to press F12 on your keyboard. This action brings up the console and opens a world of diagnostics and debugging potential.
Once you’re in, you’ll find various tabs such as Elements, Console, and Network. The Console tab will display any JavaScript errors or warnings that may be affecting your browsing experience.
This tool not only helps developers troubleshoot their sites but can also empower users to better understand potential issues. By examining scripts and network requests, you’ll gain a clearer picture of what might be troubling your web navigation. Maximising your understanding through these tools can enhance your troubleshooting skills and overall web experience!
Apple Safari
To start using the developer console in Apple Safari, you first need to enable the Developer Menu. This is a simple process: navigate to Safari’s preferences by selecting “Safari” from the menu bar and then clicking on “Preferences.” Once there, head over to the Advanced tab.
After enabling this feature, accessing the developer console becomes straightforward. Click on “Develop” in the menu bar and then select “Show JavaScript Console” from the dropdown. Alternatively, you can use the keyboard shortcut Option + C. The console will open either within your current Safari window or in a separate one, automatically landing on the Console tab for your convenience.
Chrome
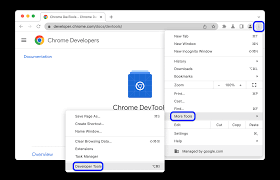
To explore web development in Google Chrome, you must first access the developer console. Locate the Chrome Menu, which is represented by three vertical dots in the upper-right corner of your browser window.
Once you click on this menu icon, navigate down to More Tools. From there, select Developer Tools to open the panel. This will reveal a wealth of information about your current webpage.
For those who prefer shortcuts over menus, there’s an easier path. On macOS, you can simply press Option + J. If you’re using Windows or Linux, a quick Shift + Ctrl + J will do the trick.
When you activate the console, it may appear as a docked window within your existing browser session or pop up in its separate window. Keep an eye out for the Console tab—this is your gateway to executing JavaScript commands and viewing error messages. With this powerful tool at your fingertips, you’re ready to start exploring and troubleshooting web applications like never before.
Mozilla Firefox
To access the developer console in Mozilla Firefox, start by looking for the Firefox Menu icon situated in the upper-right corner of your browser window. This icon often resembles three horizontal lines stacked on top of one another, commonly referred to as a hamburger menu.
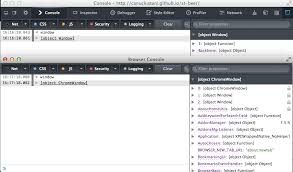
Once you open the menu, scroll down and select “More Tools.” A submenu will appear where you can click on “Browser Console.” This option provides a more comprehensive view for developers to interact with and debug their web pages.
Alternatively, if you’re a fan of quick shortcuts, there’s an even faster way to open the console. On macOS, simply press Shift + J. For Windows or Linux users, it’s Shift + Ctrl + J that will do the trick.
Upon selecting your preferred method, a new window will pop up displaying the Browser Console. Here, you’ll find a wealth of tools—be it for debugging JavaScript errors or examining network requests. With this resourceful feature, developers can better understand how their web applications behave and quickly address any issues that may arise.
Microsoft Edge
One of the first steps to dive into web development with Microsoft Edge is to access the developer console. Start by locating the Edge Menu, conveniently positioned in the upper-right corner of your browser window. Click on it, and a dropdown will appear; from there, select More Tools followed by Developer Tools.
For those who prefer keyboard shortcuts, simply pressing CTRL + Shift + I will bring up the console directly. This feature allows developers to interact seamlessly with the webpage they’re working on.
Once opened, you might notice that the console appears either as a panel within your current window or as a separate pop-up window altogether. If it doesn’t automatically land on the Console tab, don’t worry; just select it manually to begin your debugging journey.
There’s so much potential in those lines of code waiting to be explored! Whether you’re troubleshooting issues or testing new features, accessing this tool empowers you to refine your web development skills efficiently.